| Main | About | Download | Schemes | Documentation | Resources |
Features
Easy to understand output
|
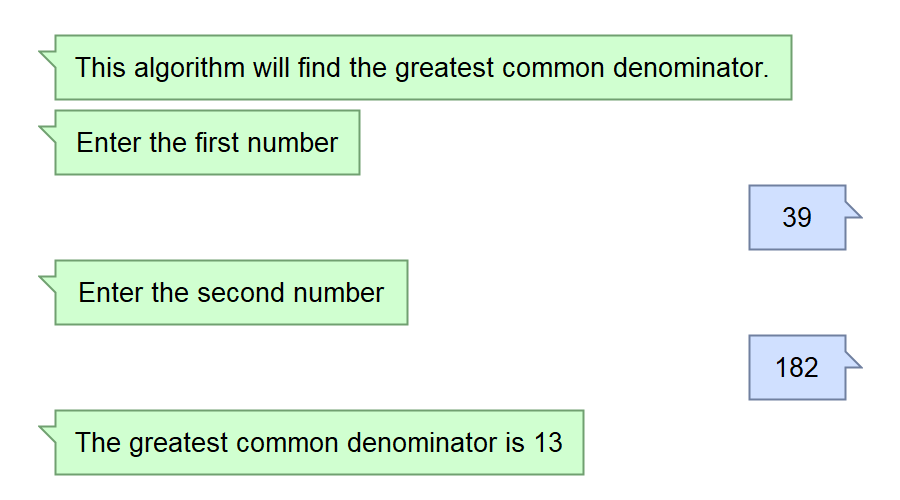
The classic method to interact with the computer is to use the "Console". Using this approach, the program displays output on a text-only screen and the user inputs data using the keyboard. Sometimes the console allows the text to change colors, but, for the most part, it is white text on a black background. The Console works, but its simple interface can make it difficult to differentiate user input and program output. So, rather than using the text-only screen, Flowgorithm attempts to make it look like a typical instant messenger window. From the programmers point of view, it looks like they are texting with the computer. The "chat bubbles" are color coded to match the Input and Output shapes used in the flowchart. In the screenshot to the right, the user's input is display in blue while the program's output is displayed in green. If you don't want to use the chat bubbles, you can also toggle between them and the classical plain text. |
 Click for a full size image |
Graphical variable watch window
|
|
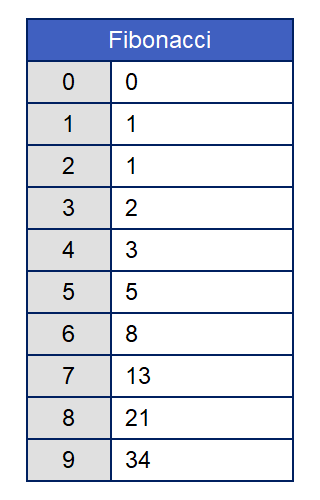
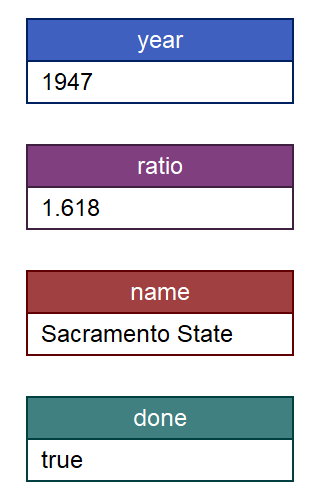
The variable watch window is used to keep track of how your variables are changing as your program executes. So, if you are stepping through your program, the window will show each variable and its current value. This is not limited to just basic variables. Arrays will be displayed as well. Each variable is color coded based on its data type. At a glace, you can tell exactly what type of data is being stored - and catch where you may want to use a different data type.
|
 |
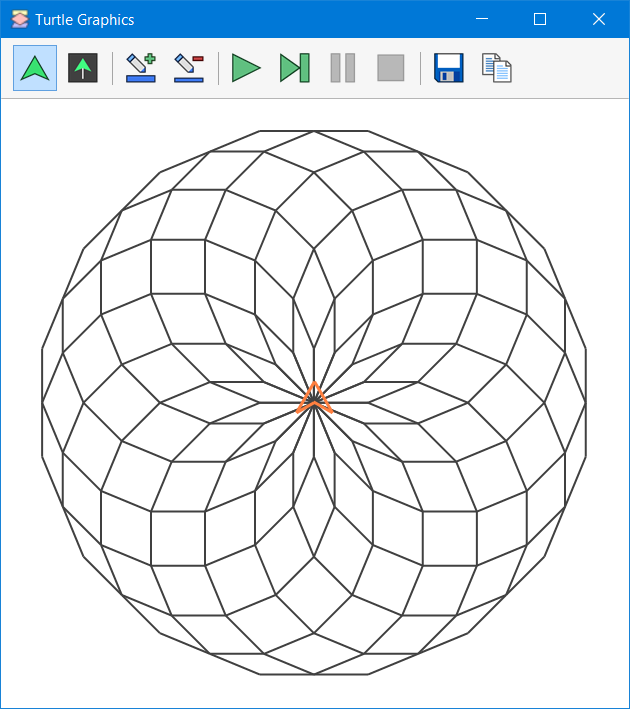
Turtle Graphics
 Version
3 introduced turtle graphics into Flowgorithm. The idea comes from the
classic programming language LOGO which was developed in 1967. It allows
images to be created by the simple actions of the "turtle" - a graphical
"brush" that can be turned and moved to create images. The goal was to teach
programming concepts through the sequential steps required to create an
image. Flowgorithm has 3 flowchart shapes that implement the features of
LOGO:
Version
3 introduced turtle graphics into Flowgorithm. The idea comes from the
classic programming language LOGO which was developed in 1967. It allows
images to be created by the simple actions of the "turtle" - a graphical
"brush" that can be turned and moved to create images. The goal was to teach
programming concepts through the sequential steps required to create an
image. Flowgorithm has 3 flowchart shapes that implement the features of
LOGO:
- Turn - changes the angle by rotating the Turtle either left or right.
- Forward - moves the Turtle the specified distance. It can move with or without leaving a line.
- Home - returns the turtle to the start position and sets the angle at 90 degrees.
The introduction of turtle graphics will give instructors one additional tool to teach programming. For example, instructors could ask the students to draw a rectangle - first through a sequence of steps, then later, using iteration.
Basic File Support
Version 3 added support for basic file input/output. Using the new four shapes, Flowgorithm and read or write simple text to a file. Students will be able to generate output files, or open input files can perform calculations on a large data set.
![]()
The shapes for Read and Write were previously defined in flowcharts. However, the Open and Close shapes are original (but designed to be visually compatible).
Customizable Color Schemes
|
Flowgorithm supports a wide-variable of color schemes. These will allow you to work, or export the flowchart to an image file, in a number of different styles and appearances. The application comes with a selection of built-in schemes. You can also download over 100 additional schemes from this website. The application, itself, can download them automatically. If you want an appearance that is not currently supported, Flowgorithm has a Color Scheme Editor where you can create your own. |
 |
 |
 |
Color Skins
With Version 3, colors can also be applied to the entire application. So, Flowgorithm can have a dark theme, light theme, or any color - for that matter. The picture below shows Cyberspace color theme applied to all windows..
Conditional Breaks
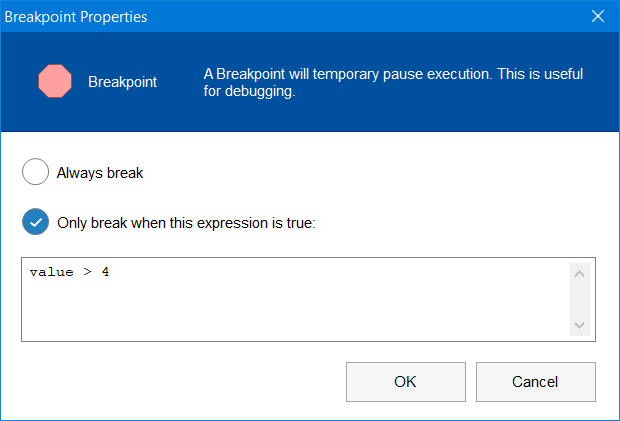 Version
3 introduced Conditional Breaks. In the previous version of Flowgorithm,
breaks would always halt program execution (the user could continue). Now,
the Breakpoint Shape either can use this behavior (the default) or only break if a conditional expression is
true. This should make the break shape a tad more useful - especially for
in-class demonstrations.
Version
3 introduced Conditional Breaks. In the previous version of Flowgorithm,
breaks would always halt program execution (the user could continue). Now,
the Breakpoint Shape either can use this behavior (the default) or only break if a conditional expression is
true. This should make the break shape a tad more useful - especially for
in-class demonstrations.
Interactively generate real code
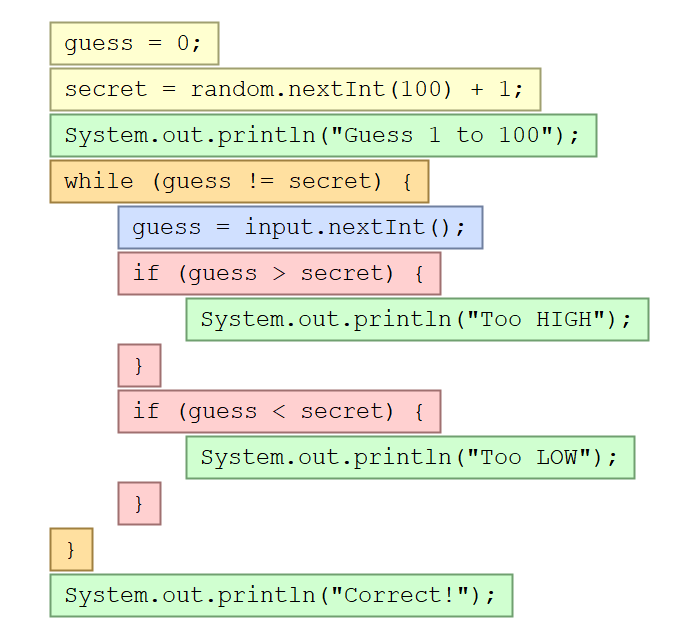 The Source Code Viewer can convert your flowchart to several major programming languages.
If you planning to learn a high-level language, then this
feature should help you along the way.
The Source Code Viewer can convert your flowchart to several major programming languages.
If you planning to learn a high-level language, then this
feature should help you along the way.
The code is highlighted using the same color used by the flowchart's matching shapes. This allows you see visually see the correlation between the code and flowchart. Also, if you highlight shapes in the flowchart, or you step through your program, the source code will be highlighted to match.
The following programming languages are supported:
|
|
|
The following pseudocode are also supported:
- Auto Pseudocode - created using the current translation such as Spanish, Arabic, Korean, Italian, etc...
- Gaddis Pseudocode - used in the book "Programming Logic and Design" by Tony Gaddis.
- IBO Pseudocode
If your programming language and/or pseudocode is not listed, Flowgorithm supports customizable program templates. These are simple text files that can be written with any text editor. Once loaded, your flowchart can be automatically converted to the target syntax. Please check out the online documentation.
Multilingual support
Flowgorithm
supports multiple spoken languages. If your language isn't currently
supported, and you would like to help create a translation, please
contact me at: Flowgorithm![]() DevinCook.com. No
programming is required. You just need to translate a simple text file..
Your help will be greatly appreciated!!
DevinCook.com. No
programming is required. You just need to translate a simple text file..
Your help will be greatly appreciated!!
|
|
|
Language features
- Single dimensional arrays
- Pre-test and Post-test loops
- For loops
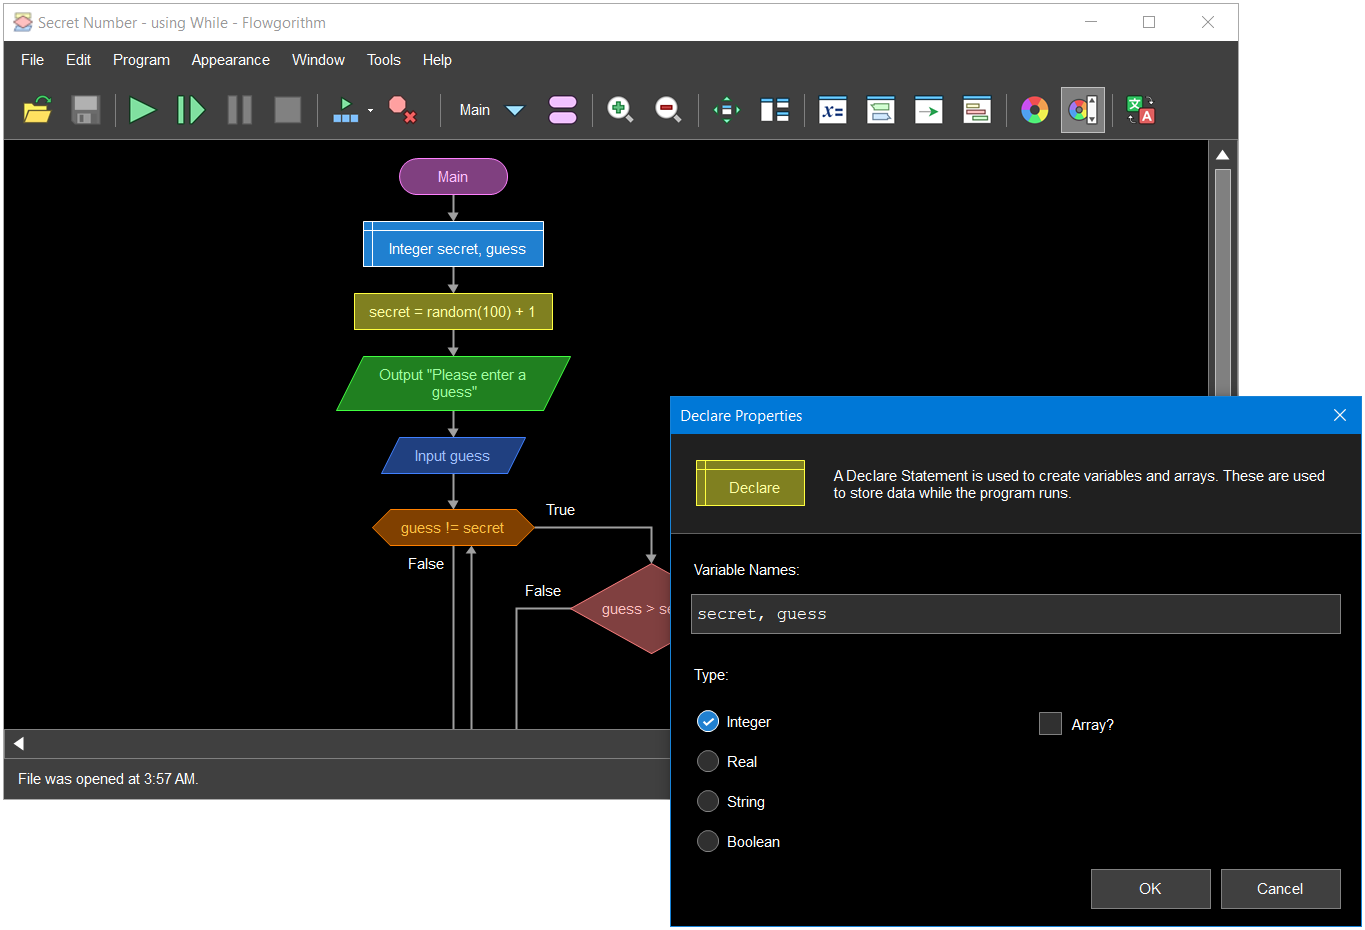
- Explicit variable declaration. Flowcharts generally use implicit declaration (given they are quite minimalistic). However, practically all languages use explicit declarations. So, it's a good idea for students to learn it from the start.
- Safe recursion. Flowgorithm maintains an internal stack (rather than the system stack). If the student accidentally creates an runaway recursive call, the program will not crash. Instead, they will receive an error message.
- Supports operators from multiple syntaxes that are used in programming languages. This includes the C family, BASIC family, and the mathematical symbols themselves (Unicode). You can use any of operators - depending on the high-level language you want to learn later.
- User-defined functions are supported. These include ones that return a value or nothing at all.
- Over 20 intrinsic functions.
In addition
- Several flowcharting styles are supported. This includes: classic, IBM, SDL, and more...
- Flowcharts can be exported to both PNG (bitmap) and SVG (vector) in any of the color schemes.
- The Editor has a feature called "Layout Windows". It is designed to help instructors show the all the needed content on the screen without having to manually resize each window (which can be monotonous).
- Programs are saved using XML.